 |
DTI visualisation.
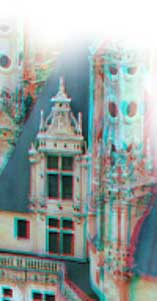
 DTI are difficult to represent for they're complex virtual objects. If I show you a MRI slice of my brain, or a 3D rendering or my brain shape, you're looking at a representation of a real object, Were I able to cut my head and pull my brain out, you'll see the same thing.
DTI are just numbers, representing the water diffusion in many direction. Simple scans include one reference and 6 DWI (Difusion Weithed Images) and complex scans up to 30. The convention is to reduce that complexity to three vectors called the eigenvectors. The main vector represent the major diffusion direction, the second and the third are orthogonal vectors that complement it to represent most of the original signal. The lenth of these three vectors are the eigenvalues.
To represent water diffusion a one point, we draw a ball, and strech it according to the three eigenvectors and eigenvalues. To color it, we use the "anisotropy" who describe how far a DTI has a specific direction. Tropy means moving. Isotropy means moving along. anisotrpy means not-moving-along. A non-directional DTI will be a gray ball. A higly oriented DTI will have a bright, saturated color. By convention, the left-right orientation is coded in red, rear-front is green and top-bottom is blue.
 |
 |
 |
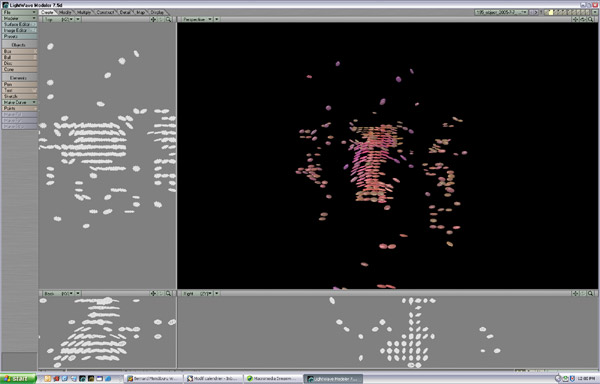
On that picture, showing the left-right oriented vectors in red, you can see the connections between the two emispheres. |
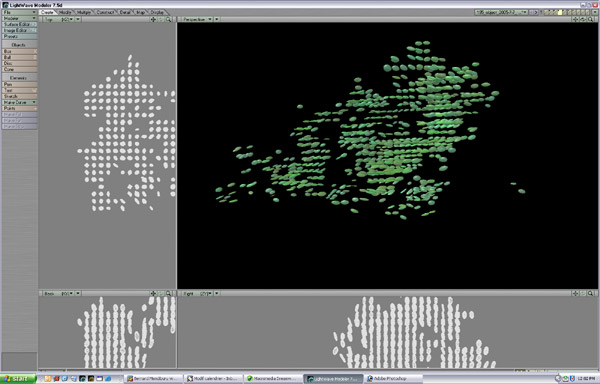
On that picture, showing the rear-front oriented vectors in green, you can see the lateral lobes. |
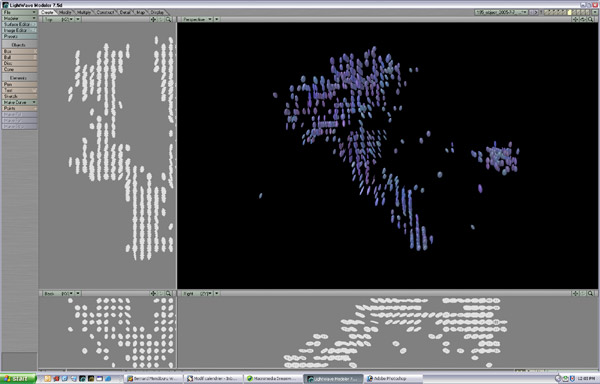
On that picture, showing the top-bottom oriented vectors, you can see the spinal cord, the frontal lobe and the visual area |
Generating theses models
The raw DWI scans come from a T3 siemens scanner. Adam Aron scanned me as a part of his experiment.The DTI computation was done using BioPse, part of SciRun from Univ. of Utah.
The first step was to filter the DTI to remove oversised glyphes on the edges of the brain [slice, unfiltered, opt-out glyphes, opt-in glyphes] Voxels with components over a fixed limit are removed.
The second step was to average the DTI in oder to remove noisy areas. Voxels are averaged in NxNxN cubes. If the resultant voxel is still anisotropic, he means it's part of a meaningfull group and will be displayed.
|
Bernard Mendiburu 6, rue Civiale, 75010 Paris, France |